Thursday, March 15, 2012

Are We in a Cyclical Bull Market Within a Secular Consolidation?

Secular (adjective) - in economics, occurring or persisting over an indefinitely long period.


With stock markets around the world continuing to rally, it seems that the all clear has been sounded.  Indeed yesterday in response to JP Morgan announcing a dividend hike, the Federal Reserve announced the results of the another round of bank stress tests.  Out of 19 banks, only four failed what seems to be a pretty dire scenario:

  • 13% unemployment
  • 50% drop in stock prices
  • 21% further decline in housing prices

To fail meant that the bank had less than a 5% capital ratio, which means the bank is not well insulated to losses.  Stocks rallied to new highs.  In response to another positive Fed report on the economy, bonds have fallen rapidly as investors see far better that 2% yields in the stock market.

Life is good again.  Or is it?  It's during this time that I feel it's necessary to look at the big picture.
  • Greece's 2nd bailout for €130 billion was approved after the successful debt-swap where approximately €200 billion of bonds were swapped with new bonds worth €100 billion.  So net-net, the Greeks are €30 billion more in the hole.
  • Spain agreed with the EU to meet a 5.3% deficit target instead of a unilaterally announced 5.8% target.  Originally Spain's deficit target for 2012 was 4.4%.  Spain's deficit was 8.5% in 2011.  In response, Spain's 10 year bond yield is rising again though at 5.17% it's not in danger territory yet.
  • Portugal's ten year bond yield is 13.72%, so don't fall into the trap thinking that Greece will be the only EU country to default.
  • Debts in other European countries remain.  Additionally these countries will need to fund their contributions to the European Stability Mechanism (ESM).  See To the Moon and Back.
  • China announced it would target GDP of 7.5% instead of 8%.  For Australia, Brazil, or Canada, which export commodities to China, this is cause for concern.  Additionally, China has been remarkable in achieving steady high returns over the years. The last time I saw such consistency with returns, people didn't think anything was strange about it either, until the floor fell out from under Bernie Madoff. 
Furthermore nothing has changed in the US regarding debt levels or a political solution to future entitlement liabilities.

While I believe that the economy has improved, how much has really changed?  In my mind, nothing has really changed.  Thus I have trouble seeing the current stock rally as anything other than a cyclical bull market within a secular consolidation.  What is a cyclical bull market? If you answered (or guessed) a bull market that lasts a few years, you are correct.  The last cyclical bull market started 2002/2003 and ran until 2007.  

In addition to cyclical bull markets, cyclical bear markets also exist.  Cyclical simply denotes a market trend that is shorter than a secular trend.  As shown on the picture below courtesy of my friends from Tesseract Asset Management (please note that the orange and green comments are mine), cyclical trends last a few years.  You can easily distinguish 2 cyclical bear markets and 2 cyclical bull markets since 2000.

Source: Tesseract Asset Management
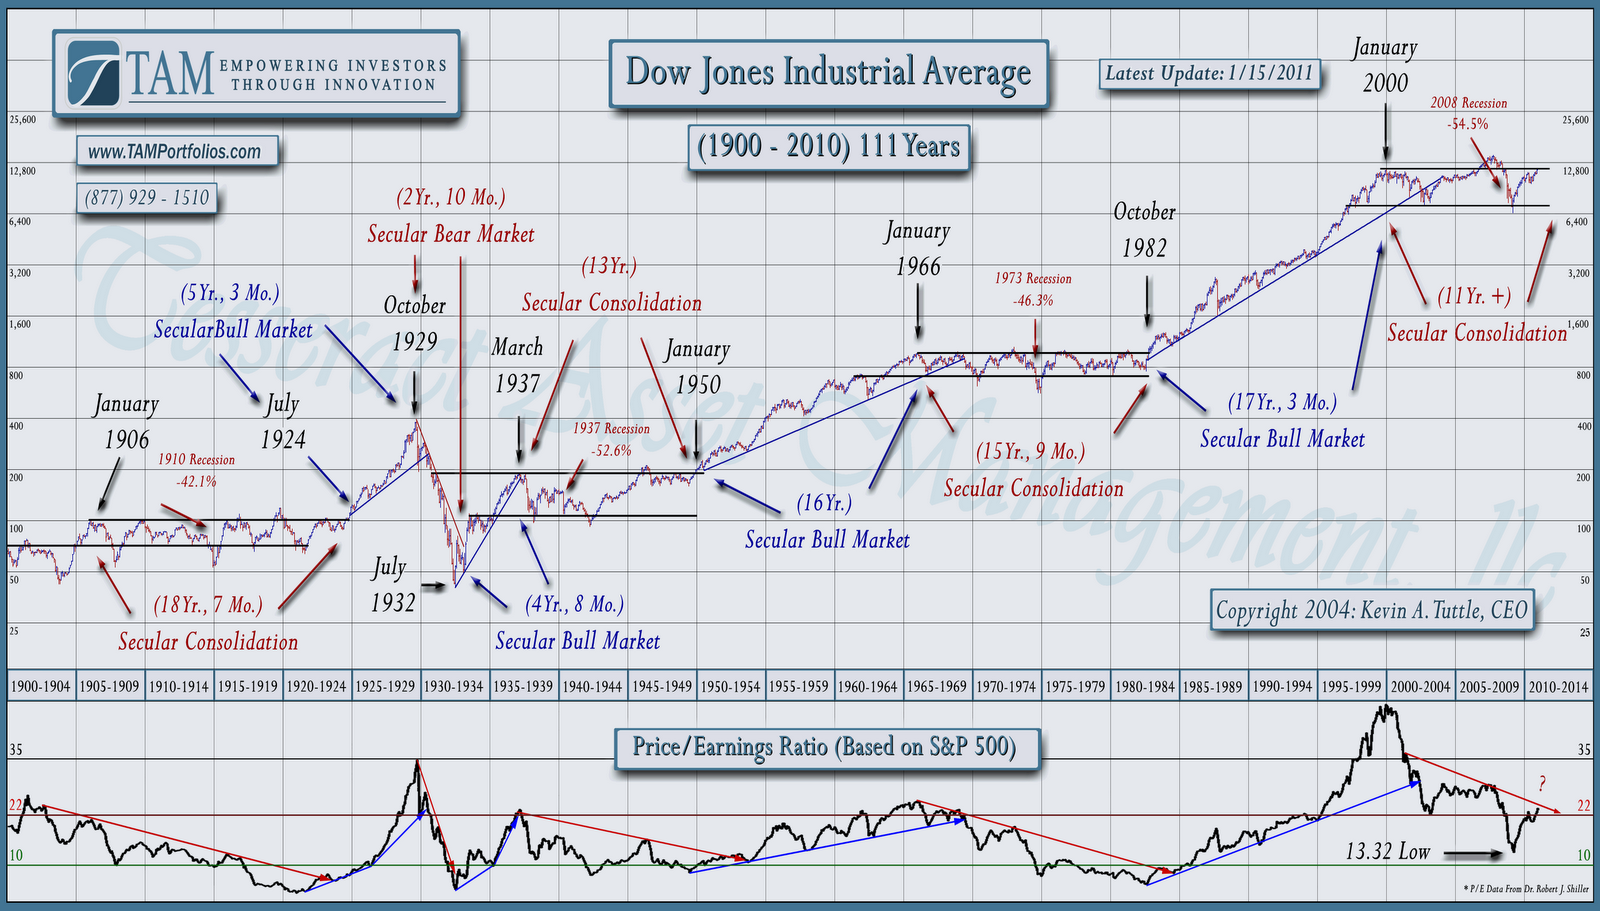
Falling back on the 100 Year Market Theory from Kevin Tuttle, stocks are overvalued if the 10 year moving average Price/Earnings ratio is greater than 22 (see also  Market Risk, Are You Managing It?). The current cyclical bull market has pushed up the market's P/E.  http://www.multpl.com/ lists the today's P/E at 23.25. 

Illustrated on the full 100 Year Market Theory chart below, we find that P/E ratios can certainly go much higher than 22.  However, secular bull markets do not start until P/E has reached 10 or less.  We're not there still.

The chart also illustrates another interesting occurrence, secular bull markets and secular consolidations take a similar amount of time to run their course.  Should this remain true, it means we still have a few more years until the next secular bull market starts.


What Does this Mean for Me

If you're have a Dollar Cost Average portfolio, hopefully you learned something new. It is a rare that I change anything in my wife's 401k throughout the course of a year.

For my Retiree portfolio, I'm staying the course as I think there is still at least as good of chance for the market to fall as to rise.  

Parting Thoughts

One interesting fact I found on http://www.multpl.com/ was the P/E for the Black Monday crash in October 1987 was ~17.5, which means that bad things can occur when investors assume a lower level of risk.  I'm not saying that a one day market crash like that will happen, or even can happen considering the rules put into place since that day.  I'm just saying that I found it interesting... 


Disclaimer: Please remember that I’m just a guy sharing information on a blog, and this is NOT official investment advice. Any action that you take as a result of information, analysis, or advertisement on this site is ultimately your responsibility. Please consult your investment adviser before making any investment decisions. During your conversation with said investment adviser, ask why they believe in their recommendation. If you are not convinced by their explanation, any action that you take or forego is also your responsibility. Just in case you missed that, you are responsible for your investments.

With that said, don’t let your investments keep you up at night. If they do keep you awake, you may be taking more risks than you are comfortable with. Talk to a professional about reallocating to less risky investments so that you can sleep. During your conversation with said professional, ask why they believe that their recommendation is less risky. If you are not convinced by their explanation, don’t invest. Remember:
  1. It’s your nest egg.
  2. Opportunities are easier to make up than losses.

Sunday, March 11, 2012

Musings on the Market March 11

Quite often when I write, I feel like I need to say something about time horizon.  If you're a long term investor, you really don't need to focus on the daily news (except my blog of course...).  Now if you have an ADD-like complex where you have to monitor all things financial and economic, welcome to my world.  Please note though that I rarely make changes to my long term allocations based upon news events.

On the One Hand

I've been reflecting on all of the news from last week, trying to assign some importance to the news compared to the risks that I've talked about in past articles.  We saw encouraging news:

  • Labor Department says 227,000 new jobs in February plus December and January were revised up by 61,000.
  • Manufacturing and Service ISM numbers are still showing expansion.
  • German exports increased 2.3% in January versus December.
  • French industrial production increased 0.3% in January versus December.
  • Greece successfully swapped it's debt.
  • The Greek debt swap was called a default for credit default swaps (CDS) because of the use of collective action clauses (CAC) to bring bond holder participation to needed levels.

New jobs means that the economy is trying to recover.  Likewise, expansion in the ISM numbers also portends to an economy trying to mend itself.

The German and French reports are important because those are the largest two economies in Europe.  If there is any hope for Europe to get through its problems, its best players need to perform.

The Greek news was encouraging because finally the EU is starting to see that they have to restructure and/or default on debt in order to get through the problem.  The other positive is that the committee that rules on defaults for CDS declared a default event had occurred.  I'm not sure any bank would have ever sold another CDS contract had that not happened.  Furthermore, who would buy sovereign debt in troubled countries if they cannot hedge their risk?

On the Other Hand

There was also conflicting data:

  • US productivity was down significantly for all 2011 compared to 2010. 0.4% vs. 4.1% respectively.
  • Unit labor cost, which includes wages, was up 2.8%.
  • The Federal Reserve is weighing a new method of easing to keep rates low.
  • The Greek debt swap was called a default for credit default swaps (CDS) because of the use of collective action clauses (CAC) to bring bond holder participation to needed levels.

Declining productivity can be attributed to many things.  As employment is rising, I consider declining productivity to be the result of new workers added to payrolls - they take longer to complete their tasks.  New workers would also explain why unit labor costs are also rising. The reason this is important though is it should lead to rising prices.  Rising prices would cause the Federal Reserve to reconsider their easy monetary policy.

A little more on the Federal Reserve, I especially like how the announcement of their "new idea" came out the day before the Greek debt swap.  As any type of new easing program is widely thought of as positive, it breathed life into markets that were looking for a new hope to cling to now that the second Long Term Refinancing Operation in Europe is completed.

Another thought on easing, if things are recovering, then why do we need more?

The Greek news was also discouraging.  From John Mauldin's Thoughts from the Frontline: There Will Be Contagion (emphasis mine)
Greece itself is in free fall. The "benefits" of austerity have not become apparent, as the Greek economy saw growth rates of -0.2% in 2008, -3.3% in 2009, -3.4% in 2010, -6.9% in 2011, and...? The 4th quarter of last year saw a GDP fall of 7.5%. Do you see a trend here? The Greek economy is down by almost one-fifth in less than five years. Unemployment has risen to 20%, and 50% among young people, many of whom are leaving the country. Resentment has grown among ordinary Greeks over the austerity medicine ordered by international creditors, which has compounded the pain. Greek papers are full of stories blaming Germany for their problems. 
By any standard, what will soon be a 20% drop can be classified as a depression. There is nothing on the horizon to suggest things will turn around any time soon. The country's public debt-to-GDP ratio currently stands at 160% of nominal gross domestic product, AFTER the debt restructuring. If Greece can find someone to lend them more money, it will only get worse. 
The current agreement with the EU will not improve the economy, but require even more wage cuts, government spending cuts, and higher taxes and unemployment. The problem is that if Greece leaves the euro, those problems do not go away, they just take a different form. There is still a great deal of economic pain for Greece as a consequence of past decisions. It is sad, but there is no other choice, unless the rest of Europe or the world, through the IMF, simply gives Greece all the money they want. But then where do you stop?
As John mentions, did you see the trend of weakening GDP?  The only way for Greece to lower it's debt-to-GDP ratio is to cut spending and grow it's economy.  The growth doesn't look promising.

By the way, John's letter is worth your time to read in full. These letters are free and you can sign up at www.johnmauldin.com.

Finally, have you ever played a game where someone tried to change the rules well after that game had started?  If you have an ultra-competitive 5 year old in your midst, you are undoubtedly nodding in agreement.  The Greek debt swap was also a negative because the CACs were added to law AFTER the bond contracts were already written.  So in addition to watching the ECB get paid in full on it's bonds, investors were forced to take their losses even if they tried to hold out.

Which leads me to my next thought - what's preventing this same routine of investing in sovereign debt, having a CAC inserted into law, and then forcing a default as part of additional bail outs from being used on other countries?

So What's This Mean to Me

I honestly do not see anything that requires me to make any changes to either my Retiree Portfolio or Dollar Cost Averaging Portfolio.  Every time I see encouraging news, I start to feel like I may miss out on something in my Retiree Portfolio.  However I then remember that nothing has really changed the overall debt picture.  Yes things look good, but as I said above, if things look so good, then why is the Fed looking to ease more?  And why is the ECB lending out more money just to cover payments of previously borrowed money?

Parting Thoughts

It's spring break, and for once in Texas, I think it'll be rather nice outside.  So far, 2012 has been warmer than I remember in years past.  And we're finally getting some ugh needed rain.  Hopefully that will continue.  If you haven't been to Texas in mid-March, let me simply say that the weather is anything but predictable. I've been on fishing trips where we've gone from sunny and 80 to cloudy, rainy, windy, and in the 40s.  Definitely not predictable.

However since my kids are out of preschool, my schedule will be predictable - predictably busy.  Still I'm hoping to discuss the 100 Year Theory Chart again, which was first revealed in Market Risk, Are You Managing It?.  I hope you have a great week!


Disclaimer: Please remember that I’m just a guy sharing information on a blog, and this is NOT official investment advice. Any action that you take as a result of information, analysis, or advertisement on this site is ultimately your responsibility. Please consult your investment adviser before making any investment decisions. During your conversation with said investment adviser, ask why they believe in their recommendation. If you are not convinced by their explanation, any action that you take or forego is also your responsibility. Just in case you missed that, you are responsible for your investments.

With that said, don’t let your investments keep you up at night. If they do keep you awake, you may be taking more risks than you are comfortable with. Talk to a professional about reallocating to less risky investments so that you can sleep. During your conversation with said professional, ask why they believe that their recommendation is less risky. If you are not convinced by their explanation, don’t invest. Remember:
  1. It’s your nest egg.
  2. Opportunities are easier to make up than losses.

Thursday, March 8, 2012

You've Got to be Kidding Me

Fool me once, shame on you.
Fool me twice, shame on me.
- unknown


If I had a nickel for every time that I could use that quote in talking about Europe's problems, the U.S. Mint would lose some serious money.  From Coin Update: Cost to Make Penny and Nickel Rises, Annual Loss Reaches $116.7 Million (emphasis mine)
The cost for the United States Mint to produce and distribute the cent and nickel rose to their highest levels, and are now more than double the respective face values. For the fiscal year ending September 30, 2011, the unit cost for the cent was 2.41 cents and the cost for the nickel was 11.18 cents.
Yet the winner in the category of You've Got to be Kidding Me, from Marketwatch: ECB to again accept Greek bonds as collateral
The European Central Bank on Thursday said it would again accept Greek government bonds as collateral in its funding operations. The bonds had been ruled temporarily ineligible for use as collateral last month after Standard & Poor's declared Greece to be in selective default. The ECB said at the time that eligibility would be restored once a previously-agreed collateral enhancement program for Greece was formally activated.
Seriously?  The results of the Greek debt swap haven't even been announced yet.  In case you didn't know, the deadline to exchange ~€200 billion Greek bonds for new bonds that retain around 30% of the original value was today.  Why would anyone do that?  Because in order to qualify for their second bailout, Greece held a gun to their debtors's heads and said 30% or 0%, take your pick.  

The biggest irony though is that the ECB received a special bond swap that paid out 100%.  What are the odds that the ECB takes a loss on any future debt swap?  The ECB will take payment in full again.  

Even better, the second bailout hasn't been paid, but there's already talk of a third bailout.  From Der Spiegel: Merkel's Government Divided over ESM Demands
Demands from abroad to increase the size of the euro bailout fund have put Chancellor Merkel in a difficult position, caught between international pressure and domestic demands. Even worse, the troika monitoring Greece's financial situation believes that a third bailout package may become necessary within a mere three years.
When is it ever going to end?  It's said that Albert Einstein said insanity is doing the same thing over and over again, but expecting a different result.  It'll be interesting to see if common sense prevails as Portugal (and possibly Spain) are next.

In some ways, the Greek debt exchange is a necessary first step.  I often write that debt can only be retired through three means - by repaying it, restructuring it, or defaulting upon it.  Finally, debt is being "defaulted" upon - even if it is "voluntary".  


Disclaimer: Please remember that I’m just a guy sharing information on a blog, and this is NOT official investment advice. Any action that you take as a result of information, analysis, or advertisement on this site is ultimately your responsibility. Please consult your investment adviser before making any investment decisions. During your conversation with said investment adviser, ask why they believe in their recommendation. If you are not convinced by their explanation, any action that you take or forego is also your responsibility. Just in case you missed that, you are responsible for your investments.

With that said, don’t let your investments keep you up at night. If they do keep you awake, you may be taking more risks than you are comfortable with. Talk to a professional about reallocating to less risky investments so that you can sleep. During your conversation with said professional, ask why they believe that their recommendation is less risky. If you are not convinced by their explanation, don’t invest. Remember:
  1. It’s your nest egg.
  2. Opportunities are easier to make up than losses.

Wednesday, March 7, 2012

Retiree Portfolio and Dollar Cost Averaging Portfolio

Offense wins games, defense wins championships.
- unknown

While we're sure to trip at times, the goal is not to fall.
- Todd Harrison


I've been debating today's topic for a few days now.  My main worry is not that the topic is controversial, but whether I can clearly articulate my point-of-view.  So with the caveat that these are my views based upon my risk tolerance, my time horizon, my investment objectives, and my desire to sleep at night, it's time to introduce the two portfolio's I commonly write about:
  1. Retiree portfolio
  2. Dollar Cost Averaging portfolio
As I cannot assume that everyone has read my previous articles, a little background on me from Maybe I'm Not a Lazy Investor:
I graduated college in the late 90s to a job with an S&P 500 software firm. Among my benefits was a 401k retirement plan with a generous company match of 50 cents on the dollar up to ten percent of my salary. Knowing a good thing when I saw it, I immediately enrolled into the 401k program for ten percent of my salary. After reading a few investment articles and talking to family and friends, I selected 4-5 stock mutual funds to diversify my fledgling nest egg. My primary screen was fund performance and low cost. 
Over the initial years, I have to admit a gratifying satisfaction watching my account balance rise with the stock market. I took up finance and economics as a minor hobby reading the occasional magazine article and watching CNBC. As with much of the nation, I was enamored with the idea of striking it rich in technology or Internet stocks. 
However this joy came to an end that I never saw coming. In March 2000, people decided that companies should earn a profit and not simply count how many eyeballs look at them daily. Over the next several months, the stock market crashed and so did my 401k. 
During this time, I did what I was supposed to do. I kept on buying, which dollar-cost averaged my nest egg into cheaper shares. Still, that didn't take the pain away. I decided that I needed to learn how to look for warning signs of future market crashes, as well as learn from my mistakes - such as not having diversified into a bond fund those initial years, which would have significantly cushioned the blow.  
...
October 2007 was a notable month as I decided to move on from the same software company to the position of stay-at-home dad. It was also notable as I couldn't get my retirement money out of the 401k plan and into a rollover IRA at Vanguard fast enough. While you might think I was in a hurry because Vanguard invented the low cost index mutual fund, you would be wrong. 
Since the Nasdaq Crash of 2000, I had become a voracious reader of economic and financial subjects. 
... 
This time I saw the financial storm on the horizon known as the US housing crisis, and I was determined to save my hard earned retirement nest egg.
The Genesis of My Retiree Portfolio

I am a huge proponent of dollar cost averaging.  The primary advantage of dollar cost averaging is buying more shares at lower prices should the stock market drop.

However being a stay-at-home dad, I no longer dollar cost average into my 401k as I have no income.  In this respect, my 401k resembles a portfolio of a retired individual, which is why I call it my Retiree Portfolio.  And like a retired person, my primary objective for this portfolio is capital preservation - I don't want to lose a lot of money if there is a foreseeable crisis.

Although I'm a proponent of lazy investing, I saw no reason to let the storm known as the 2008 Financial Crisis decimate my retiree portfolio.  So I tried to protect the portfolio from losses as best as this engineer-want-to-be-investor could by managing risk. Thus what you see in the table below are my Retiree Portfolio allocations.


 Table 1: Retiree Portfolio Asset Allocation
Fund/Asset Percentage
Money Market Funds
~34%
Intermediate Treasury Bond Fund
~14%
Ginnie Mae Bond Fund
~10% 
Inflation Protected Securities Fund
~17%
S&P 500 Index Fund
~4%
Total Bond Market Index Fund
~9%
Gold ETF
~12%


Please note that I selected the allocations in table 1 to help me weather the financial crisis.  This is NOT a recommendation for your portfolio.  Remember that I do not know you, your risk preferences, your time horizon, or your investment objectives. Furthermore you should not change your portfolio based solely on something that you read on this blog (or any blog for that matter).  Please review the disclaimer at the end of the article for more information.

As I mentioned in Stay True to the Path or Take the Fork in the Road, cash is a legitimate position.  The only risks to cash is inflation and missed opportunities.  In order to hedge inflation risk, I chose to buy a gold ETF and inflation protected securities.  For general protection in 2008, I thought bond funds would do well as any return is better than the negative return I foresaw in stock markets.  The Total bond market index fund provided general protection across short, intermediate and long term bonds.  I added intermediate treasuries because they provided a better yield than short term, but less potential risk than long term and corporate bonds.  Ginnie Mae bonds are government-backed mortgage securities that also provided better yields.

While I have made few changes since 2008, I may make significant changes any time now as I have considerable exposure to the bond market. While interest rate risk is not yet keeping me up at night, it is something that I think about regularly. Interest rates can only go so low before they begin to rise again.  When that happens, bonds will lose money. I'm still formulating a course of action. So if this article causes you to think, "I'm putting more into bond funds" - please understand that I believe that they are no longer the safe allocation as they are traditionally perceived.

In 2007/2008, my goal was simply to make it through the crisis without taking a significant loss.  While I'm disappointed to have missed out on the stock market returns since March 2009, I take comfort in the fact that losses I had were minimal and that this portfolio grew better than 15% since October 2007.  Though nothing to brag about, I'll take the smooth low returns over the experience of large losses when the stock market dropped over 50%.

Dollar Cost Averaging Portfolio

While I no longer contribute to a 401k, my wife does.  Additionally, she recently started with a new company, so I was excited to see what investment options were available.  As what has been typical in my 401k experience, there was a dearth of index funds.  However, here are the funds that I chose for her along with the overall allocation.


 Table 2: Dollar Cost Averaging Portfolio Asset Allocation
Fund/Asset Percentage
S&P 500 Index Fund
15%
TRP Blue Chip Growth Fund
10%
Fidelity Low Priced Stock Fund
15% 
MSIF Small Cap Growth Fund
15%
DFA Emerging Markets Fund
15%
Harbor International Fund
10%
Nuveen Real Estate Fund
10%
PIMCO Total Return Fund
10%


Again, table 2 is NOT a recommendation for your portfolio.  Remember that I do not know you, your risk preferences, your time horizon, or your investment objectives. Furthermore you should not change your portfolio based solely on something that you read on this blog (or any blog for that matter).  Please review the disclaimer at the end of the article for more information.

Looking at the table above, you may be shocked to see 90% allocated to stock funds and only 10% to bonds.  Here is my rationale for these selections:

As my wife started recently, there have been minimal contributions to this account. Hence there is no significant account balance to be lost. As there is no significant balance, a large stock market loss means the next contribution very quickly averages the overall cost per share down. Thus I'm choosing funds that are considered more risky, like small company, mid-company, emerging markets, international stocks, and real estate. While this may seem counterintuitive to some people, I experienced the positive results when the stock market rose from the 2000 crash until 2007.

Additionally we have a long time horizon, so we can wait out any downturn.  Within this time horizon, small and medium companies should grow.  So I have allocated 30% of funds towards these categories. Likewise, I believe that international stocks will grow well as other nations want to be prosperous like the U.S.  Thus 25% of funds are allocated to international and emerging markets.  Also, bond rates will at some point rise.  While bond funds will lose money when that happens, dollar cost averaging enables me to again buy cheaper shares.

By now you've probably realized that I'm treating the dollar cost averaging portfolio on the complete opposite end of the spectrum as the retiree portfolio.  Again with regular contributions, my wife's portfolio is managing market pricing risk by buying cheaper shares in any downturn.  Even though we're in our mid-to-late 30s, this portfolio illustrates the advantage of a long time horizon, which is being able to weather more risk.

Parting Thoughts

I chose today's quote because much like sports, investing isn't about a single game - it's about the whole season. Championship teams can lose a few games during the season. However in order to win the season, you must have a defensive strategy to manage risks. Dollar cost averaging is one proven method to play defense in your retirement strategy.

In my Retiree Portfolio, I concentrated entirely on defense by selecting bond funds.  This worked - though not everyone wants or has the ability to actively monitor and manage risks.  This is why lazy investing shines, and one reason why I recommend lazy portfolios. Lazy portfolio's are another defensive strategy.  No doubt this is one of several reasons why many investment professionals use them.

For more information on lazy investing, check out:
Or look for the following books at your library:

  • The Little Book of Common Sense Investing by John C. Bogle
  • Millionaire Teacher by Andrew Hallam


Disclaimer: Please remember that I’m just a guy sharing information on a blog, and this is NOT official investment advice. Any action that you take as a result of information, analysis, or advertisement on this site is ultimately your responsibility. Please consult your investment adviser before making any investment decisions. During your conversation with said investment adviser, ask why they believe in their recommendation. If you are not convinced by their explanation, any action that you take or forego is also your responsibility. Just in case you missed that, you are responsible for your investments.

With that said, don’t let your investments keep you up at night. If they do keep you awake, you may be taking more risks than you are comfortable with. Talk to a professional about reallocating to less risky investments so that you can sleep. During your conversation with said professional, ask why they believe that their recommendation is less risky. If you are not convinced by their explanation, don’t invest. Remember:
  1. It’s your nest egg.
  2. Opportunities are easier to make up than losses.

Monday, March 5, 2012

Keep It Short and Sweet

I hope everyone had a good weekend because it's back to the grindstone today.  I'll admit that I spent almost no time this weekend thinking about the markets or what was going on in the world.  It was wonderful to "get away."

However I did run across another piece I want to share.  I originally read this when Paul Farrell first published it on Marketwatch, but had totally forgotten about it until this weekend (hat tip: Big Picture Blog).  This one is from several years ago, and similar to lazy investing that I introduced in Maybe I'm Not a Lazy Investor, I do not ever see it going out of style.  From the creator of Dilbert, Scott Adams: The Unified Theory of Everything Financial.
Quietly hidden in Adams' groundbreaking work is a financial formula so simple it rivals Einstein's E=mc2. In its original form Adams' formula was apparently so heretical and so explosive that no major house would touch it when he proposed publishing it as a one-page book. After initial rejections, he announced sadly that "if God materialized on earth and wrote the secret of the universe on one page, he wouldn't be able to find a publisher" either. 
Fortunately for America's 95 million investors, Adams' secret nine-point formula was finally revealed in "Dilbert and the Way of the Weasels." Notice its simple brilliance in the exact reproduction of his formula:
  1. Make a will
  2. Pay off your credit cards
  3. Get term life insurance if you have a family to support
  4. Fund your 401k to the maximum
  5. Fund your IRA to the maximum
  6. Buy a house if you want to live in a house and can afford it
  7. Put six months worth of expenses in a money-market account
  8. Take whatever money is left over and invest 70% in a stock index fund and 30% in a bond fund through any discount broker and never touch it until retirement
  9. If any of this confuses you, or you have something special going on (retirement, college planning, tax issues), hire a fee-based financial planner, not one who charges a percentage of your portfolio
Adams boldly states that this is "everything you need to know about personal investing." In just 129 words, nine simple points, one page you have the unabridged "Unified Theory of Everything Financial." That's it. Everything!
And I'm not going to muddy up the waters with any other comments, except to say - I agree, and I hope you have a good week!


Disclaimer: Please remember that I’m just a guy sharing information on a blog, and this is NOT official investment advice. Any action that you take as a result of information, analysis, or advertisement on this site is ultimately your responsibility. Please consult your investment adviser before making any investment decisions. During your conversation with said investment adviser, ask why they believe in their recommendation. If you are not convinced by their explanation, any action that you take or forego is also your responsibility. Just in case you missed that, you are responsible for your investments.

With that said, don’t let your investments keep you up at night. If they do keep you awake, you may be taking more risks than you are comfortable with. Talk to a professional about reallocating to less risky investments so that you can sleep. During your conversation with said professional, ask why they believe that their recommendation is less risky. If you are not convinced by their explanation, don’t invest. Remember:
  1. It’s your nest egg.
  2. Opportunities are easier to make up than losses.

Thursday, March 1, 2012

Worthwhile From the Web: Thoughts on Retirement with Dignity 2.0

The tiny, initial clue ... by allowing us to imagine what we do not know, stimulates a desire for knowledge.
- Marcel Proust


Knowing is not enough; we must apply. Willing is not enough; we must do.
- Johann Wolfgang von Goethe


Welcome to Worthwhile from the Web.  Ok, the name is corny, but I wanted you to be able to easily distinguish independent articles that deserve your time from my own articles (that also deserve your attention).

Tonight's article is from The Big Picture Blog and likely requires more than 1% of your time.  Written by a bond manager, it provides an in-depth look at what an 80th percentile, middle-age baby boomer likely faces regarding future retirement.  Entitled Thoughts on Retirement with Dignity 2.0, the author reviews these baby boomers backgrounds, prospects for retirement, options in achieving retirement, and implications on the economy.  Here's a preview:
The 80th percentile 57 year old household income is little changed from 2 years ago (or 4 years ago, for that matter) and stands at $150,000. They have, on average, a $200,000 mortgage on a home valued in the low $300 thousands. (The value was $370,000 in 2007). If they have a 401K or IRA, the balance is approximately $100,000. Other assets and liabilities are very difficult to generalize and quantify. The quantity and frequency of debt beyond a first mortgage is significant and so is non-retirement plan financial assets, but they appear to generally offset each other. It is safe to say that; if you Google Earthed the $315,000 neighborhood in Columbus, Ohio and pulled out the 57 year old household, you might find that their home equity loans, education loans and auto loans offset their financial assets excluding home and retirement accounts. If that were the case, they are $100,000 in the hole with eight years to go to retirement.
...
Since 1999, the S&P 500 Index is flat, but there have been two 50% decline phases and numerous leadership changes. In general, the public has been put through a meat grinder in the stock market for the last 12 years.
...
Based on a conventional approach, these 57 year olds need to accumulate about $3 million in retirement savings in the next 8 years in order keep everyone happy. That figure is based on the calculation that they need to replace $150,000 per year in employment income when they quit working and they will receive about $30,000 in Social Security, leaving a $120,000 funding gap. It takes $3 million to fill the gap at a 4% distribution rate.
...

I came up with 3 primary actions that can be taken in order for these 57 year olds to retire comfortably, if taken together. All of them will have a potentially negative impact on the economy.
1. Postpone retirement to age 70 or older
2. Cut the household budget and save the difference
3. Liquidate debt by downsizing
...
They need to take the $115,000 in spending down to, say, $75,000. Talk about choking the horse. But it certainly can be done. That will facilitate $40,000 in annual savings, but what is really cool is that, after adapting to the pain of austerity and establishing a less expensive lifestyle, the savings goal drops to $1,080,000! 
Whether you are baby boomer or just starting out, I strongly encourage you to read the complete article Thoughts on Retirement with Dignity 2.0.


Disclaimer: Please remember that I’m just a guy sharing information on a blog, and this is NOT official investment advice. Any action that you take as a result of information, analysis, or advertisement on this site is ultimately your responsibility. Please consult your investment adviser before making any investment decisions. During your conversation with said investment adviser, ask why they believe in their recommendation. If you are not convinced by their explanation, any action that you take or forego is also your responsibility. Just in case you missed that, you are responsible for your investments.

With that said, don’t let your investments keep you up at night. If they do keep you awake, you may be taking more risks than you are comfortable with. Talk to a professional about reallocating to less risky investments so that you can sleep. During your conversation with said professional, ask why they believe that their recommendation is less risky. If you are not convinced by their explanation, don’t invest. Remember:
  1. It’s your nest egg.
  2. Opportunities are easier to make up than losses.

Light at the End of a Tunnel or a Coming Train

If you saw a potential train crash coming, would you stand on the tracks in the hopes that the train might stop in time, or get out of the way?  Many Europeans from Greece, Portugal, Spain, and Italy are choosing to get out of the way.  The potential train wreck they foresee is either their country abandoning the euro or a possible break-up of the euro-region.

Regardless, this leads to the possibility of returning to the drachma, escudo, peseta, and lira for these countries.  A return to any or all of these currencies would very likely lead to a large currency devaluation - meaning a $5 bottle of wine could very well cost $10.

Thus these Europeans are protecting their wealth by moving it to other countries they assume will keep a strong currency. By moving their wealth, these Europeans hope to retain its value by retrieving it after the devaluation occurs. From Der Spiegel: Southern European Money Migrating North to Safety
Nowhere, though, has capital flight reached the dimensions that it has in Greece. According to data released on Monday by the European Central Bank, deposits in Greek banks plunged by 17 percent last year. Other countries in crisis have also seen declines, but they have been much smaller. In Ireland, deposits fell by 6 percent, in Spain it was almost 3 percent, and in Italy it was just under 2 percent. By comparison, deposits in Germany in the same time period climbed by 3 percent and, in France, the increase was fully 10 percent.


Yet as deposits leave these countries, the situation leaves their banks with a shortfall in funding.  The graph above illustrates the relative amounts borrowed by European banks from the European Central Bank (ECB).  In July 2010, Portuguese banks required over 25% of Portugal's monthly economic output in loans to continue operating.  And from ~June 2011, the trend for Greece, Spain, and Italian banks has been to borrow more money.

This graph also illustrates why European banks need the ECB's Long Term Refinance Operation (LTRO).  These banks desperately need capital in order function.  Without the ECB loans, everyone would see that these banks are insolvent because they would need to shut down.  Take a look at the growth of loans leading up to the LTRO spike in December 2011 in the graph below.


The growth starts around June 2011 and then spikes in December with the LTRO.  As noted in To the Moon and Back:
What about the Long Term Refinancing Operation (LTRO) by the ECB - didn't it loan out nearly €500 billion in December? As revealed by Hussman Funds in Five Global Risks to Monitor in 2012, the €500 billion is more like €191 billion. (emphasis mine) 
While there was much fanfare last month after the ECB loaned 523 banks 489 billion euros, the actual amount of new funds was a more modest number. This is because two earlier loan programs expired on the same day as the three-year LTRO was held, and banks probably rolled these funds into the three-year operation. The earlier operations included a 3-month loan of 141 billion euros offered in September, and a net 112 billion euros of overnight loans. The ECB also allowed banks to shift 45 billion euros from an October operation into the 3-year LTRO. Of the 489 billion Euros operation, that left about 191 billion euros of fresh loans.

That spike looks about right for that amount.

Yesterday the ECB loaned more than €500 billion to 800 banks in the second installment of the LTRO - meaning Europeans continue to protect their wealth by moving it to safer destinations.  I agree as they would be insane to trust good intentions.  Why risk the light being a train?

The ECB is buying more time for leaders to try and find a solution.  The game of extend and pretend goes on.


Disclaimer: Please remember that I’m just a guy sharing information on a blog, and this is NOT official investment advice. Any action that you take as a result of information, analysis, or advertisement on this site is ultimately your responsibility. Please consult your investment adviser before making any investment decisions. During your conversation with said investment adviser, ask why they believe in their recommendation. If you are not convinced by their explanation, any action that you take or forego is also your responsibility. Just in case you missed that, you are responsible for your investments.

With that said, don’t let your investments keep you up at night. If they do keep you awake, you may be taking more risks than you are comfortable with. Talk to a professional about reallocating to less risky investments so that you can sleep. During your conversation with said professional, ask why they believe that their recommendation is less risky. If you are not convinced by their explanation, don’t invest. Remember:
  1. It’s your nest egg.
  2. Opportunities are easier to make up than losses.