Wednesday, February 29, 2012

Tracking Your Path to a Financial Future

I was scamming those guys for months. Every transaction, I kept a little.
You?
It was easy. Cash deposits! 
Millions of dollars in small bills changing hands.
Who's going to miss $10,000 here, $20,000 there?
Drug dealers.
That's right.  They did. It's why I'm living out of a suitcase now.
- Lethal Weapon 2


Yes, it's that time of the month again - where we get to play "Where did my money go?"  In November 1999, this "game" was like running lines (a.k.a. suicide drill) in basketball practice where you run to the free throw line and back, half court and back, far free throw line and back, and full court and back.  Did I mention the loser gets to go twice?

Seriously I had no clue of where my money was going.  Even better, sometimes I got to play the game a week early.  When I tried to remember what I did that month, I always thought "it's not like I'm living extravagantly."  

For example, my one bedroom apartment cost less than $500 per month.  When I found it I thought "perfect", though I could tell by the look my hot realtor gave that she wouldn't be visiting if we ever dated.  I guess she didn't understand that I needed to save a few bucks if I ever wanted to take her out for something more than a hot dog.

Furthermore I didn't have new furniture or electronics or car.  The only debt I had was a student loan, and a credit card that I paid off monthly.  I was a frugal person.

Frugal as in - thrifty, economical, careful, cautious, prudent, unwasteful, sparing, scrimping; abstemious, abstinent, austere, self-denying, monkish, spartan; parsimonious, miserly, cheeseparing, penny-pinching.  Ok, I don't know about cheeseparing, which sounds like something done in Wisconsin, but I was frugal.

Where did my money go? Why was I unable to save anything? How could I possibly ever meet any financial goals?

If you haven't guessed already, tonight's discussion is tracking your expenses because if you don't know where your money is going, you shouldn't be surprised when you wake up thinking "I've been working for X number of years and what do I have to show for it?"

While it may seem like wasted time, tracking your expenses is beneficial because then you be able to: 
  1. Set financial goals.
  2. Monitor where you spend money.
  3. Budget future expenses.
  4. Cut unneeded and unnecessary expenses. 
  5. Project Future Expenses.
  6. Save.
*By the way if you already track your expenses, feel free to skip to the bolded section title In Other News.

Setting Financial Goals

Saving for an emergency fund, buying a new car, saving a downpayment for a house... Setting financial goals is easy because financial goals tend to be our dreams, our desired future.  Realizing that dream, let's just say there's a reason it's called work.

Monitoring Where You Spend Money

Monitoring where you spend your money is the first step in planning your financial future.  While it may seem mundane to write down your rent, utilities, and groceries on a monthly basis, the really tedious part is writing down your cash expenditures.  It takes discipline and is completely necessary if you want to know where you spend your money.

Regarding how you monitor your spending, you have many options:
  • Paper - I remember watching my father write entries on paper while watching Sunday sports.
  • Computer programs - several are available.  The reviews you can find online will be better than any I can provide.
  • Spreadsheet - being frugal, I chose to make my own spreadsheet to track my finances.
Tracking Finances with a Spreadsheet

After only one month of tracking my spending cash, I was able to pinpoint why I was always asking "where did my money go?"  It was going to lunches, eating out on weekends, road trips to see my friends, beer, and cover charges.  And in case you're wondering, I had a section in my spreadsheet for cash expenditures that I tracked to the dollar as tracking to the penny wasn't worth it.

Budgeting Future Expenses

After tracking your expenditures for a few months, you will then be able to budget. To budget means that you devise a spending plan based upon your income and your financial goals.  Then you evaluate the plan based upon your expenditures and achieving your financial goals. 

If you budget successfully the first time, congratulations - you are either very good at matching income to expenses OR earn a lot of money.

If you were not successful, try again by cutting expenses, picking up an odd job, or getting a roommate to share the rent. And don't feel too bad because the government isn't very good at budgeting either and they've had a lot more time to practice.  Remember though that like government, you can take out debt to make ends meet. Unlike government, you cannot print your own money or raise your own debt limit to keep things going.  Avoid debt at all costs.

Cutting Unneeded and Unnecessary Expenses

Everyone who has written this topic takes a free shot at $4 lattes and work lunches.  However have you ever looked at how much a month you spend on ATM fees?  Taking your money out once can result in a fee up to several dollars.  Do it multiple times in a month and you may be able to treat a few friends to $4 lattes.  Through budgeting, you should be able to take money out once a month which limits ATM fees.

Budgeting also aids you in identifying other unneeded or unnecessary expenses.  When it comes to meeting your financial goals, gym memberships, weekly massages, designer clothes/shoes, cable TV, and even cars can be unnecessary.  By the way if you disagree because you need one of those items to do you job, then it is a necessary expense - not unnecessary one.

Projecting Future Expenses

I'm probably a nerd (my wife just said, "what do you mean probably? You developed your own spreadsheet.") because I love projecting how future financial scenarios impact my goals.  Tax return coming?  Now we meet our vacation budget.  Unexpected bonus?  Now we'll be able to pay off a student loan 6 months earlier.  And what can we do with that extra money once it is paid off?  Thank you budgeting.

Saving

Here's one tip that I read a long time ago: Pay yourself first.  When you get a check, set aside $25, $100, whatever amount in savings.  Pay yourself before paying rent, utilities, anything.  This is important because remember that you work to make your life better, not just to pay the bills.  By paying yourself first in your budget, you force yourself to review what is unneeded and unnecessary.  Thus, budgeting also enables you to save.  (Check out Time is Money or Time Earns Money to learn about the dynamics of saving and compound interest.)

Summary

Ultimately by tracking you finances, budgeting your expenses, and saving, you will achieve your financial goals.  Now get to it!


In Other News: Let's Revisit Our Discussion on Risk

Building on Market Risk, Are You Managing It, there was an article in Marketwatch yesterday about price earnings ratio of the S&P 500. From Stock valuations now versus last April:
The S&P 500 index, for example, is just 0.3% higher now than where it closed at the end of last April. For all intents and purposes, that’s a wash — especially considering the extraordinary volatility the market has had to endure along the way.
...
Consider first the price-to-earnings ratio when calculated on the basis of trailing as-reported earnings. The reason to calculate the ratio this way: It’s comparable to the historical values back to 1871 that are included in the database maintained by Yale University finance professor Robert Shiller. ( Click here to access that database. )

That ratio for the S&P currently stands at 15.2. The comparable ratio at the end of last April stood at 16.6. So at least according to this measure, stocks are about 8% cheaper today than last April.

What about the so-called Cyclically Adjusted Price Earnings ratio, or CAPE, which Shiller has proposed as a superior measure of stock market valuation? It currently stands at 22.7, versus 23.7 at the end of this past April — a 4% improvement.

Though the magnitude of these improvements are perhaps not overwhelming, at least their trends are in the right direction.
The Cyclically Adjusted Price Earnings ratio is the 10 year moving average discussed in Market Risk, Are You Managing It.  Back to the article:
Though Shiller’s Cyclically Adjusted Price Earnings Ratio is slightly lower than it was at the market high last April, it remains significantly above its long-term norms. In fact, it is 38% higher than the ratio’s average back to the late 1800s, and 43% higher than its median.

This cannot easily be dismissed because Shiller’s CAPE has an impressive record forecasting the market’s long-term return. Consider a simple econometric model that uses the CAPE to predict the S&P 500’s inflation-adjusted dividend-adjusted return — a model that is quite significant at the 95% confidence level that statisticians often use to determine if a pattern is genuine.

That model’s current forecast: Less than a 1% annualized real total return over the next decade.
Very interesting indeed... and with that, it's time to call it a night.


Disclaimer: Please remember that I’m just a guy sharing information on a blog, and this is NOT official investment advice. Any action that you take as a result of information, analysis, or advertisement on this site is ultimately your responsibility. Please consult your investment adviser before making any investment decisions. During your conversation with said investment adviser, ask why they believe in their recommendation. If you are not convinced by their explanation, any action that you take or forego is also your responsibility. Just in case you missed that, you are responsible for your investments.

With that said, don’t let your investments keep you up at night. If they do keep you awake, you may be taking more risks than you are comfortable with. Talk to a professional about reallocating to less risky investments so that you can sleep. During your conversation with said professional, ask why they believe that their recommendation is less risky. If you are not convinced by their explanation, don’t invest. Remember:
  1. It’s your nest egg.
  2. Opportunities are easier to make up than losses.

Monday, February 27, 2012

Market Risk, Are You Managing It?

History doesn't repeat, but it often rhymes. 
- Mark Twain


Before we get into today's edition of 14 Minute Investor, I wanted to share why I've been missing in action these past few days.  In case you haven't read Maybe I'm Not a Lazy Investor, my full time occupation is stay-at-home dad.  Occupied is exactly what my 5 year old and 2 year old keep me.  Rather than delve in the details, please understand that I usually find myself writing after bedtime - more often than not, my own bedtime.  So while I strive to write one article for each day of the workweek, please forgive me if I miss a day.  I'd rather skip a day than try to rush an article out that isn't up to my standards.

Now on to the article...

Have you ever wondered what the difference is between good investors and great investors?  While I cannot say that I have a complete answer to this question, I know one difference is how each investor manages risk.

What Influences Your Investment Decisions

Very early in my investing lifetime, I looked at the past returns of my 401k mutual funds and said, "I want those returns."  As I started in the late 1990s, the returns were large by historical standards.  Indeed I got to enjoy about 2 years of nice returns.  However, the good times came to an end.  From Maybe I'm Not a Lazy Investor:
In March 2000, people decided that companies should earn a profit and not simply count how many eyeballs look at them daily. Over the next several months, the stock market crashed and so did my 401k. 
During this time, I did what I was supposed to do. I kept on buying, which dollar-cost averaged my nest egg into cheaper shares. Still, that didn't take the pain away. I decided that I needed to learn how to look for warning signs of future market crashes, as well as learn from my mistakes - such as not having diversified into a bond fund those initial years, which would have significantly cushioned the blow.
... 
Since the Nasdaq Crash of 2000, I had become a voracious reader of economic and financial subjects.

Source: Yahoo


Did you notice anything in particular about my opening sentence?  Here it is again: Very early in my investing lifetime, I looked at the past returns of my 401k mutual funds and said, "I want those returns."  One word stands out to me - returns.  I was managing for returns, and my portfolio suffered.  

What I should have been doing was managing risk. Managing risk is critical because if you do a poor job managing risk, then losses hinder the potential growth of a portfolio.  For example if you lose 50% of your portfolio, then you need a 100% gain simply to get back to even. 

By prudently managing risk, investment returns will follow as losses should prove minimal.  And while there are several types of investment risk that need to be managed, this article introduces one type - market risk.

Measuring Market Risk in 1999

Remembering those days 12 years ago is somewhat of a blur.  One thought I clearly remember is "from now on, I want to know what the 'smart money' is doing.  Certainly the smart money knows about managing risk."  I cannot recall how many websites and periodicals I reviewed attempting to find the "smart money" as it was a lot.  Being frugal, I decided to try a magazine subscription or two and then focused on finding the best material that was free over the Internet. One of the websites that I discovered was Minyanville.

Minyanville is the brainchild of CEO Todd Harrison who created it to give something back to the community after many successful years in the financial industry. Minyanville's mission is to affect positive change through financial understanding, from the ABCs to the 401(k)s. With a roster of more than 40 world-class "Professors" comprised of traders, money managers and some of the best minds in business, readers can find well over a dozen free daily articles as well as subscription products.

I spent a LOT of time and learned a lot of things on Minyanville.  Today, I'm going to share one of the most memorable things I saw there about 8 years ago.  As you might guess, it's centered on market risk.

Source: Tesseract Asset Management

Much like the concept of lazy investing, the chart above from Kevin Tuttle of Tesseract Asset Management (formerly Tuttle Asset Management) was an eye-opener to me, and let me tell you why.

In front of you is 103 years of the Dow Jones Industrial Average (DJIA) living history. Broken into two sections, this chart displays the price history of the DJIA over time on top, and the 10 year moving average Price/Earnings (P/E) ratio of the S&P 500 on the bottom.

Now for the uninitiated, P/E is a standard measure of risk. It tells you how many dollars you are paying for $1 of earnings performance.  From the articles I was reading back then, $15 was considered fairly valued.

Taking a look at the chart's P/E section, you'll note the two horizontal lines representing P/E ratios of 10 and 22.  At 10, stocks are considered undervalued and on sale.  At 22, stocks are considered overvalued and at risk of falling in price.

Take a look at the year 1999.  I wish I had seen this chart back then as the P/E portion of the chart was lengthened vertically just to fit the curve.  Stocks were not only overvalued, but in orbit with the International Space Station.

Taking a Closer Look at Cyclical Market Risk

I am grateful to have permission to use the 2010 chart, so let's take a closer look at all of the information we can gain from it (please click the image to enlarge it).

Source: Tesseract Asset Management

To this day, I have never seen a chart like this.  This chart is significant because it matches up market risk versus price performance in an easy-to-read graphic - not a table that listed over a range of years both the high/low price for a year, the high/low P/E for that year. Thus we can visualize the long-term, or secular, trends easily.

Focusing on the P/E portion again, we see that market risk is constantly changing.  Over many years though, these changes trend from low-to-high P/E (represented by rising blue line) to high-to-low P/E (represented by falling red line).  Note that the blue lines always start at or below an undervalued P/E of 10.  Likewise, the red lines always start at or above an overvalued P/E of 22.

Now let's look at the DJIA price history.  The first thing I notice are rising blue lines designating rising stock prices.  These rising stock prices directly correlate to the blue lines below designating a rising P/E and take place periods many years.

Next, the black "channels" designate years where the market remains within a price range, or as the chart says - experiences a secular consolidation.  These black channels, as well as the market crash from the Great Depression, directly correlate to the red lines designating a falling P/E.

Putting it all together, we see that over long periods of time, the stock market cycles from undervalued to overvalued and back. Note that secular bull markets can go up far longer than many would think prudent.  Additionally caution should be exhibited in overbought markets as they tend to work themselves out as either:
  1. a function of price, meaning a large, "quick" drop in price like in the Great Depression - bringing the overall P/E ratio down to undervalued levels, or
  2. a function of time, meaning a long multi-year, secular consolidation where corporate earnings catch up to price - bringing the overall P/E ratio down to undervalued levels.
Benefits of the 100 Year Market Theory Chart

As the quote of today's article says, history doesn't repeat, but it often rhymes.  Since 2000, the stock market has been consolidating as a function of time.  Reading the 100 Year Market Theory Chart, we see that the 2008 crash has yet to tag the traditional undervalued P/E of 10.  Thus, it can be surmised that the current secular consolidation that started in 2000 should continue.

Yet A Word of Caution

Even though the 100 Year Market Theory illustrates that stock market risk cycles from undervalued to overvalued, policy intervention from governments and central banks may prevent markets from hitting a P/E of 10. 

As mentioned in How Many Bulls in this Rodeo, Clowns Want to Know world central banks are flooding global markets with liquidity.
The G4 central banks (http://www.cumber.com/content/misc/G4_Charts.pdf) have taken the size of their collective balance sheet from $3.5 trillion to $9 trillion. That number is likely to rise. The G4 have extended duration so that the focus of their policy is not just in the overnight lending rate or in the very short term. Massive liquidity has blunted liquidity squeezes everywhere in the world.
... by unleashing a flood of liquidity in the form of low interest rates, quantitative easing, and refinancing operations, world central banks distort financial markets encouraging investors to take on more risk. Stocks are a natural fit, especially with reports and prognostications of an improving economy. Furthermore, the Federal Reserve has strongly hinted at more quantitative easing in December and January.

Now put yourself in the shoes of a financial manager. Your worst fear is the thought of underperforming your peers. To a financial manager, underperformance is worse than losing money. Thus it is to be avoided at all costs.
Liquidity finds a home in stocks and commodities, pushing up prices.  Can policy intervention start a new secular bull market when P/E hasn't hit the traditionally undervalued mark?  That remains to be see.

Another risk that I know I've beaten to death is the debt.  Can liquidity beat debt?  Again that remains to be seen, but debt has to be paid, restructured, or defaulted upon.  Whether we like it or not, we certainly do live in interesting times.

Parting Thoughts

The 100 Year Market Theory Chart bestows different benefits to different people.  For those who dollar cost average in their retirement plans, the chart provides a powerful incentive to continue the course during the current secular consolidation.  Your risk is managed by constant buying regardless of direction.  When the next secular bull market starts, you will be very happy.  Dollar cost averaging enabled me to regain from my losses much quicker than had I given up in 2000.

For people like me with retiree plans, the chart provides guidance on when taking more risk with our precious funds is prudent.  No one wants to out live their retirement funds.

While there's much more that can be discussed about 100 Year Market Theory Chart, it's time to wrap up this article.  Be assured that I will revisit the chart in future articles as today was really an introduction.  As a side note, I look forward to the 2011 chart.  As the market basically had a flat year and corporate earnings improved, I predict that the P/E line should have ended 2011 lower.  How much lower - I can't wait to see.

Finally in the spirit of finding the best material that's free over the Internet, I did see that Tesseract Asset Management offers Free Research. While I have yet to receive my first email, I will say that I read Kevin's work whenever I see it on Minyanville.  So I look forward to my first installment.


Disclaimer: Please remember that I’m just a guy sharing information on a blog, and this is NOT official investment advice. Any action that you take as a result of information, analysis, or advertisement on this site is ultimately your responsibility. Please consult your investment adviser before making any investment decisions. During your conversation with said investment adviser, ask why they believe in their recommendation. If you are not convinced by their explanation, any action that you take or forego is also your responsibility. Just in case you missed that, you are responsible for your investments.

With that said, don’t let your investments keep you up at night. If they do keep you awake, you may be taking more risks than you are comfortable with. Talk to a professional about reallocating to less risky investments so that you can sleep. During your conversation with said professional, ask why they believe that their recommendation is less risky. If you are not convinced by their explanation, don’t invest. Remember:
  1. It’s your nest egg.
  2. Opportunities are easier to make up than losses.

Thursday, February 23, 2012

Despite Optimism, Europe is on Edge of Recession

With all the optimism that Europe is recovering from the debt crisis, all eyes are on released economic data. Today, we get the preliminary February Purchasing Managers Index (PMI) for the Europe.  As reported in Marketwatch: Weak PMI fans euro-zone recession fears.
The preliminary composite purchasing managers index fell to 49.7 in February from 50.4 last month, according to financial-information-services firm Markit, which compiles the index. A reading of less than 50 signals a contraction in activity.

Economists had forecast a rise to 50.8. The decline reflected a fall in the services PMI to 49.4 from 50.4 in January. The manufacturing PMI rose to 49.0 from 48.8 in January, a six-month high.

“A retreat back below the 50.0 no-change level for the euro-zone PMI is a disappointment, and highlights the ongoing risk that the region may be sliding back into recession,” said Chris Williamson, chief economist at Markit.

Euro-zone gross domestic product saw a quarterly contraction of 0.3% in the final three months of 2011 after growth of 0.1% in the third quarter. A recession is loosely defined as at least two consecutive quarters of shrinking GDP.
While analysts say that this report may or may not mean a recession will happen, I like to go to the source to see the details, which can be quite good.  Unfortunately due to the late hour and copyright laws, I am unable to include any information found in the source report because I do not have prior permission.  (I will work on this for the future.)

However, I encourage you to check out the report as it is only 3 pages and has commentary supported by numerous graphs.  If you simply want the highlights, skip to the Summary of February data on page 3.  The report can be found on Markit's website under Markit Commentary.  Here is a direct link to the PDF: Eurozone business activity slips back into contraction in February.

Looking at the trends in the graphs, the case can easily be made that the EU is on the edge of recession.  Personally with all the austerity, I do not foresee Europe avoiding a recession.  As noted in It's Just a Minor Flesh Wound, they're already halfway there.


Disclaimer: Please remember that I’m just a guy sharing information on a blog, and this is NOT official investment advice. Any action that you take as a result of information, analysis, or advertisement on this site is ultimately your responsibility. Please consult your investment adviser before making any investment decisions. During your conversation with said investment adviser, ask why they believe in their recommendation. If you are not convinced by their explanation, any action that you take or forego is also your responsibility. Just in case you missed that, you are responsible for your investments.

With that said, don’t let your investments keep you up at night. If they do keep you awake, you may be taking more risks than you are comfortable with. Talk to a professional about reallocating to less risky investments so that you can sleep. During your conversation with said professional, ask why they believe that their recommendation is less risky. If you are not convinced by their explanation, don’t invest. Remember:
  1. It’s your nest egg.
  2. Opportunities are easier to make up than losses.

Wednesday, February 22, 2012

Gold, Energy, and Unintended Consequences in the Headlights

Serendipity - the occurrence and development of events by chance in a happy or beneficial way.


Ok it's already late, and I want to cover a range of items in this article.  So let's jump right in...

Even More on Gold

A few hours after I posted Gold, Another Diversification Option, I received John Mauldin's free weekly Outside the Box newsletter to which I am a subscriber.  This week's letter provided some background on why investors like Warren Buffet think of gold as a bad investment choice.  Simply stated, Benjamin Graham, Warren's mentor, never invested in it.
According to Graham, while no one can tell the future, there are periods when the valuations of stocks and bonds would deviate from fair value by becoming excessively over- or undervalued. To enhance returns and reduce risk, investors should alter their portfolio allocations accordingly. A quick look at a long-term chart supports Graham's theory clearly shows periods when one asset class offered a better value than the other:

But what of the periods when both stocks and bonds stagnated or fell together? For much of the 1970s and again from 2001 through today, any portfolio allocated solely between stocks and bonds would have at best treaded water and at worst drowned in a sea of stagflation. To earn any real return, an investor would have needed to seek alternatives. 
It's clear from this next chart that gold was exactly that alternative, a powerful counter-trend investment for periods when both stocks and bonds were overvalued. Yet gold is conspicuously absent from Graham's allocation model. 

But this missing asset class is entirely understandable: for most of Graham's adult life and the most important years of his career, ownership of more than a small amount of gold was outlawed. Banned for private ownership by FDR in 1933, it wasn't re-legalized until late 1974. Graham passed away in 1976; he thus never lived through a period in which gold was unmistakably a better investment than either stocks or bonds. 
All of which makes us wonder: if Graham had lived to witness the two great bull markets in precious metals during the last 40 years, would he have updated his allocation models to include gold? 
We can never know.
This confirms what I said in Gold, Another Diversification Option:
Just like all investment classes go in and out of favor, I believe the same is true for gold. 
As I mentioned, I am a John Mauldin subscriber.  John puts out two well thought out newsletters weekly - Thoughts from the Frontline and Outside the Box.  These letters are free and you can sign up at www.johnmauldin.com.

Wrapping Up the Gold Discussion

After writing Gold, Another Diversification Option, I received the following request.
Could you describe how you go about selecting which gold fund to invest in? What tools / logic do you use?
Whenever I buy into a mutual fund or an ETF, I follow the basic premise behind lazy investing as told in Maybe I'm Not a Lazy Investor.
Thus if you build a diversified portfolio of low-cost stock and bond index mutual funds, you stand a very good chance of earning a higher return than you would otherwise. Why is it called lazy investing? Primarily because the only action required is an annual rebalancing of your portfolio to ensure that it stays diversified. Total time required to rebalance is less than 15 minutes for the entire year. (Read the How To Build a Lazy Portfolio here) 
This information all made perfect sense to me. The only hiccup to implementing this in my 401k plan was the lack of low cost index mutual funds. So I did my best by picking the lowest cost funds that gave me exposure to the large company US stocks, small company US stocks, international stocks, and bonds.
There is not an index fund for gold or gold mining companies, so I look for funds that have a low expense ratio and good performance over the last 10 years. Low cost (expense ratio) is important because it's the only choice that I have control over. Yes investing is a choice too, but when you're in a mutual fund or ETF, it's the investment manager that chooses the individual investments. Cost is all I can control.

Additionally I want good performance over the past 10 years because gold's in a big bull market. If a manager cannot make money in a bull market, then it's time to find a new manager.  Note you will also want to screen for no load funds.  Loads are a fee mutual fund companies collect to pay financial advisors for recommending their product.  Stay away from load funds as that's lost money from the beginning.

Finally, you can use any screener to find this information.  For mutual funds, I had the best luck using Morningstar.com with the following settings:
  • Fund group: Commodities
  • Morningstar Category: Equity Precious Metals
  • Load Funds: No Load Funds Only
  • 3, 4, & 5 star funds
  • 10-year return greater than or equal to: Category average
There were 11 funds listed, most with an expense ratio around 1%.  

For ETFs, I used google and found the ETFdb: The Comprehensive & Original ETF Database.  This wasn't around years ago, but made finding the ETFs available easy.  I'll make it easier on you by linking directly to:
By the way, I've invested in both gold and gold miners for diversification.  They tend to move together, but just in case one soars, I want to take advantage of it.  Also please remember that you need to investigate all ETFs and mutual funds thoroughly before investing.  Otherwise please talk to you financial advisor. 

Moving on to Other Thoughts

This past weekend I played golf with one of my best friends, Rudy.  It had been awhile since we had last seen each other, so we caught up on each other's lives and eventually I brought up this blog.  The conversation immediately turned to investing, and to a topic where my buddy is intimately familiar - energy.

Rudy's knowledge of energy comes from working for a large construction firm that among other things builds and maintains power plants and storage facilities. He mentioned that while things have been steady, energy expansion is ramping up quickly to keep up with demand.  I wish I had kept notes, but needless to say, my friend is bullish on energy.

My conversation with Rudy focused my mind.  I have always liked energy as an investment because everyone uses it every day.  I admit that I have been cautious about the sector (probably too cautious) because when recession hits again, energy demand will fall, which will lead to lower prices.  On the other hand, energy will always come back because as I said, everyone uses it every day.

While driving home from the golf course, a number of recent issues came to mind:
  • Tensions with Iran could lead to higher oil prices.
  • Japan has shutdown all nuclear power plants, so it'll need to find another energy source somewhere.
  • Germany pledged to shutdown all nuclear power plants by 2020, so it too will need another energy source. 
  • Central bank liquidity needing to find a place to call home.
I think this bodes well for energy producing companies, countries, and those companies that support them.

Unintended Consequences

Unintended consequences seem to happen any time there is a mix of politics and economy.  As Bloomberg reports in Euro-Area Central Banks Said to Swap Greek Portfolio Bonds.
Euro-area central banks will swap the Greek bonds in their investment portfolios for similar securities to avoid enforced losses during a debt restructuring, a euro-area official said.

The swap will happen today and is identical to one the European Central Bank carried out last week with the Greek bonds acquired in its asset-purchase program, the official said. The new Greek bonds will be immune to collective action clauses, or CACs, ensuring central banks don’t incur any losses when a private-sector debt write-down takes place, the official said on condition of anonymity. A spokesman for the Frankfurt-based ECB declined to comment.
Central banks decided that they didn't like their bond contracts that they voluntarily entered into when they purchased said bonds.  So they decided to change the contract by swapping old bonds for new bonds that wouldn't be subject to any losses.  What could go wrong here?  

Essentially central banks have told all other bond investors that their holdings are now junior to central bank holdings.  A dangerous precedent has now been set for other countries where central banks have bond holdings, namely Italy and Spain.  While the EU wants investors to buy sovereign bonds from Italy and Spain to keep rates low, what investor in his right mind would now did so since central banks have proven that they can change the rules of the game in the 2nd half?

The ECB better hope that the Long Term Refinance Operation (LTRO) money is used to buy sovereign debt because they will one day find out that no one else is going to buy it.

Looking Ahead in the EU and U.S.

Ironically what made me start this section was looking back at what I've written so far. The first big date to look ahead to is February 29th in the EU.  The second installment of the LTRO is due, and I've heard that it may loan out LESS money than the first issue this past December.  

We'll have to wait and see what happens, but remember as I stated in It's Only Good for a Limited Time:
... by unleashing a flood of liquidity in the form of low interest rates, quantitative easing, and refinancing operations, world central banks distort financial markets encouraging investors to take on more risk. Stocks are a natural fit, especially with reports and prognostications of an improving economy.
If there is less money loaned out, that means less liquidity added.  Stock may well fall as they have stalled at the current level several days.  

The payroll tax cut has passed Congress, but don't count on a large boost to spending as reported in the Big Picture Blog Greece/China/gasoline prices
In the US, gasoline prices according to AAA rose for the 26th straight day yesterday, up by .03 over the weekend to $3.57 per gallon. Over this time frame, prices are up about .20 which equates to about $28b annualized out of consumer pockets, almost 1/3 of the payroll tax cut.
Finally QE3 is still waiting should stocks drop to much.  Again from the Big Picture: Here Comes Dow 13,000. Then What?
The post credit crisis sequence seems to operate thusly: Markets slide lower on weak fundamentals. They accelerate down on stop losses and risk management. They plummet on panic. The intervention of some sort occurs. The experienced market/Fed watchers know the impact, and jump in. As markets move off lows, some value types, cycle historians, and then technicians jump on board. The rally may be distrusted or even hated, but eventually trend followers then momentum boys join the party. Pretty soon, its all aboard the Love Train, and not too long after, markets reach their over bought condition. The cycle begins anew.

I wonder what the plan is when the payroll tax cuts and income tax rates expire come January 2013? Or is that going to be the next administration's problem?

Parting Thoughts

For the first time since 2007, I'm thinking that I need to add stock exposure in my retiree portfolio.  In particular, I will be investigating, with the intention of buying, mutual funds that invest in energy companies.  As I'm not sure what the market will do, I plan on scaling my purchases.  This means I'll divide up my total investment and make my purchases over many months.  In other words, this method is really dollar cost averaging in disguise when investing a preset amount. 

Did I mention that you need to read the disclaimer below?


Disclaimer: Please remember that I’m just a guy sharing information on a blog, and this is NOT official investment advice. Any action that you take as a result of information, analysis, or advertisement on this site is ultimately your responsibility. Please consult your investment adviser before making any investment decisions. During your conversation with said investment adviser, ask why they believe in their recommendation. If you are not convinced by their explanation, any action that you take or forego is also your responsibility. Just in case you missed that, you are responsible for your investments.

With that said, don’t let your investments keep you up at night. If they do keep you awake, you may be taking more risks than you are comfortable with. Talk to a professional about reallocating to less risky investments so that you can sleep. During your conversation with said professional, ask why they believe that their recommendation is less risky. If you are not convinced by their explanation, don’t invest. Remember:
  1. It’s your nest egg.
  2. Opportunities are easier to make up than losses.

Tuesday, February 21, 2012

Gold, Another Diversification Option

You've heard of the Golden Rule?
Whoever has the gold, makes the rules.
- Jafar from Disney's Aladdin

Regardless of the movie genre, you can always find some truth in movie dialog - even in a Disney movie. While today's quote is the perfect segue into why there has been a lack of financial fraud prosecutions since the beginning of the debt crisis, this blog attempts to steer clear of political discussions.

Source: Transactional Records Clearinghouse at Syracuse University

Thus while the above chart sickens me, it is not today's topic.  So then why the Disney quote you might ask?  Gold.

Even if this blog goes viral, I'll never have the amount of gold required to make the rules. However I can still use gold investments to retain wealth.  Why?  Because regardless of what you read, gold is a store of value, which is one way of saying gold is money.  Think about this, if someone offered you a certified gold bar for your house, would you turn them away or check how many dollars you would receive upon cashing it in?

Gold Another Diversification Option for Your Portfolio

Most people think of gold as protection against inflation.  Overall I think this is true, but only relative to the investment time.  Just like all investment classes go in and out of favor, I believe the same is true for gold.  

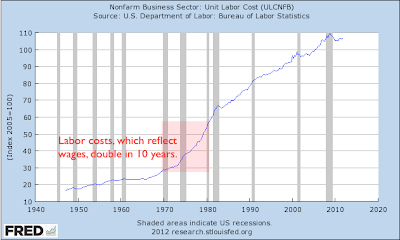
For example in the 1970s, prices were rising for everything thanks to government spending programs, Vietnam, and the oil embargo. Note below in the Consumer Price Index, prices roughly doubled from 1970 to 1980.


Labor costs, which reflect wages, also double during this time period.


Also President Nixon closed the gold window, which meant the U.S. government would no longer convert dollars to gold.  The price of gold would freely float against the dollar. Accordingly as prices for everything continued to increase, so did the price of gold.

Source: Kitco.com
Add the Iran Hostage crisis with the appearance that inflation was never going to end, you have a situation where investors will seek safety for their wealth.  Gold prices went vertical.

The Gold Investment Fad Ends

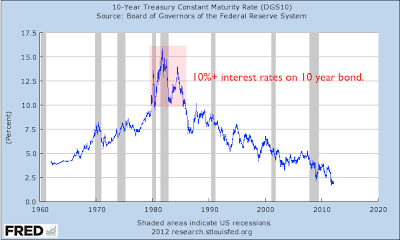
Moving on to the 1980s and 1990s, Paul Volcker's Federal Reserve turned inflation to disinflation (meaning the rate of prices going up was decreasing) by means of high interest rates.  New bonds issued by the U.S. Treasury attracted attention as high rates could be locked in for up to 30 years.  Additionally if interest rates fell, these bond prices would rise, so you earn a gain on the price you paid if you sold.

Stocks were attractive too as their prices relative to earnings were low.  As interest rates fell, companies and consumers could borrow more to buy more.  This led to growing sales and a growing economy, which brought higher stock prices.  New industries were created - computers, software, internet, which led to more growth.  

All of this stability and growth made gold unattractive versus these other opportunities even though there was inflation in the economy. One traditional safe investment, the ten year bond, was paying over 10 percent in the early 1980s.  The thirty year bond could be bought for close to the same rates too! 


Compared to a dividend paying stock or a bond, gold doesn't earn a return.  Hence gold prices fell from their high as better returns were to be made elsewhere.

Source: Kitco.com

Droughts Seldom Last Forever

Fast forward to 2000, stock markets are spiking to all time highs.  However earnings for many companies are questionable.  Price-to-earning ratios are astronomical even for companies that earned money.  Bonds earned a decent return around 6%.  

Now if you were invested in stocks, where do you store hard earned gains if it appears everything is going to fall?  Remember in a stock rout, everything gets sold even good companies.  The reason behind this phenomenon is leveraged investors (e.g. investors who borrowed money to buy stocks).  As the amount of collateral in their account retreats, these investors get a margin call.  At that moment they either need to add more cash/collateral, or sell what they can to meet the requirements.  Hence good companies get sold because the bad companies are not worth enough to cover the margin call.  Therefore, all stocks fall.

So bonds are one option for hard earned gains because if the Fed lowers interest rates, the prices of your bonds would rise and you could profit from that rise.  Also, you buy stuff that everyone needs - energy, commodities, and gold.

Source: Kitco.com

Response and Affect

Instead of dealing with the economic imbalances created, the Fed did lower rates after the market crash of 2000 and kept them low for many years.  Whenever the Fed loosens monetary policy, the new money that floods into the system needs to find a "home." Coincidentally, homes were exactly where the money went.

Low interest rates spurred a housing boom.  Home ownership became more affordable. Combined with new financial "products," more people were able to acquire a mortgage than ever before.  This led to a construction boom and rising home prices.

Additionally, current homeowners could refinance into a cheaper interest rate.  Again combined with rising home prices, many of these owners went on spending sprees.

As the economy looked like it was better, the Fed raised interest rates.  Unfortunately few thought about whether the newly issued debt was going to be paid back.

A New Crisis

Summarizing the last few years, debts could not be repaid.  Home values crashed in places where prices had sky rocketed.  Stocks plummeted over 50% though now are back to within 15% of their all time highs.  Bond yields are near all time lows with the 10 year Treasury hovering around 2%.  Gold is down ~10% from its all time high, but up over 500% since 2000. While that is a nice gain, here are the reasons why I still like gold:
  1. Savings accounts have no return at best, negative return if you include inflation.
  2. Bonds have the same problems as savings accounts.  Furthermore bonds are vulnerable to a rise in interest rates, which will cause bond prices to fall - leading to a probable loss if you sell.
  3. Central banks continue an activist policy of trying to relieve financial stress by adding liquidity. As noted in Stay True to the Path or Take the Fork in the Roadthese policies do not solve the problem of too much debt.
  4. High debt - until the growth of debt around the world is brought under control, we will continue to have slow growth at best.  Without even thinking recession, a no growth scenario could cause stock prices to roll over.
  5. Insurance against Congress doing something really stupid.
So by diversifying into gold, I hedge losses in my savings accounts and bonds.  I also take advantage of all gains caused by central bank action.  Finally while I wouldn't bet on Congress doing something stupid, stranger things have happened.  Gold provides some insurance that some wealth survives any Congressional storm.

Ironically, I'm not the only one who likes to own gold.  According to the Wall Street Journal, central banks began buying gold again. Regardless of what you read/hear, gold is money.  (hat tip: Big Picture Blog)

Source: Wall Street Journal

Wrapping Up

There are a number of methods to get exposure to gold in your portfolio.  I list some of these methods plus some of their advantages and disadvantages.  Please consult your financial advisor to discuss which choice(s) might be right for you.

 Table 1: Methods to Buying Gold
Solution How Advantages/Disadvantages
Buy Gold through an investment firm that deals in gold coins or bullion. Pro: you have physical possession.
Con: you have to safely store it.
Gold ETF through your brokerage account. Pro: you have claim to gold in a safe location.
Con: you may not be able to physically retrieve your gold. Also you have to pay a management fee.
Gold Mining Stocks buy individual stocks through your brokerage account.   Pro: fixed costs means any rise in gold price is profit.
Con: mining is risky, gold may not be found. Potential for currency risk if not a US company. Stock price likely to drop in a crash (though it's likely it rebounds well too).
Gold Mining ETF or Mutual Fund buy an ETF or mutual fund through your brokerage account. Pro: owning many companies is less risky.
Con: fund expenses may be high.  Potential currency risk.

For the record: I own shares of a gold ETF and gold mutual fund.  I may buy more or sell these investments at any time without warning.  


Disclaimer: Please remember that I’m just a guy sharing information on a blog, and this is NOT official investment advice. Any action that you take as a result of information, analysis, or advertisement on this site is ultimately your responsibility. Please consult your investment adviser before making any investment decisions. During your conversation with said investment adviser, ask why they believe in their recommendation. If you are not convinced by their explanation, any action that you take or forego is also your responsibility. Just in case you missed that, you are responsible for your investments.

With that said, don’t let your investments keep you up at night. If they do keep you awake, you may be taking more risks than you are comfortable with. Talk to a professional about reallocating to less risky investments so that you can sleep. During your conversation with said professional, ask why they believe that their recommendation is less risky. If you are not convinced by their explanation, don’t invest. Remember:
  1. It’s your nest egg.
  2. Opportunities are easier to make up than losses.

Sunday, February 19, 2012

It's Only Good for a Limited Time

It's the economy, stupid. - Bill Clinton


What keeps you up at night?  Recently I can say this blog is keeping me awake, though it's because I'm busy typing in front of my computer instead searching for the cool spot on my pillow.  Still in the spirit of the question, one item that keeps recurring in my mind is bullish stock analysts versus my hesitance to reallocate into stock mutual funds.  As I wrote at the end of To the Moon and Back:
I'm still not sold on buying stocks for my "retiree" nest egg, but I do find that I'm questioning it more every day.
For new readers, please read Maybe I'm Not a Lazy Investor and Stay True to the Path or Take the Fork in the Road for the background on why I'm bearish on stock investing.  If you don't have the time right now, I can boil it down to a simple phrase - it's the debt, stupid!

Now About Those Bullish Analysts

I wish I was keeping a list of headlines that articulate the views of bullish stock analysts since I started this blog.  Likewise, I could keep a tally of bullish stock commentary on CNBC, but I don't think my 2 and 5 year old would buy my argument that my count is more important than Curious George on PBS.  Nonetheless my point is that the quantity of bullish stock commentary I'm seeing dwarfs calls for caution.

To be fair, the analysts in To the Moon and Back spoke about how central banks have calmed markets down and provided optimism, which lead to a recommendation of buying stocks for the months ahead.

Additionally in How Many Bulls in this Rodeo, Clowns Want to KnowDavid Kotok from Cumberland Advisors stated:
The key to watch is in the credit markets. Credit spreads tell a story of overwhelming liquidity being applied to the financial-system open wounds like a steroidal salve. Such treatment can alleviate interim pain. It is treatment for the symptom; it works for a while. It does not provide a permanent cure. (emphasis mine)
Ok, by unleashing a flood of liquidity in the form of low interest rates, quantitative easing, and refinancing operations, world central banks distort financial markets encouraging investors to take on more risk.  Stocks are a natural fit, especially with reports and prognostications of an improving economy.  Furthermore, the Federal Reserve has strongly hinted at more quantitative easing in December and January.  

Now put yourself in the shoes of a financial manager.  Your worst fear is the thought of underperforming your peers.  To a financial manager, underperformance is worse than losing money.  Thus it is to be avoided at all costs.  David Kotok admits as much in his recent commentary Stocks Upward Bias, Golden Cross, Risk Rising:
Liquidity-driven rallies are extraordinarily strong. The central banks of the world have increased their balance sheets by trillions, and the short-term interest rate is near zero. If you use the short-term rate to compute an equity risk premium, you get a huge number. Of course, we know that zero is a poor standard. Moreover, we know that it will not last forever. In addition, we believe there will be a penalty to pay for this prolonged period of zero-cost financing. However, while we wait the party continues. It is harder and harder for folks to stay on the sidelines. It is too soon to abandon the bull market.
One Big Difference Between Me and the Analysts

While reading this article, and perhaps previous articles, did you pick up the big difference between me and the analysts?  Time horizon.

Liquidity from central banks is much like the McRib, it's only good for a limited time.  Limited time is the same as short term in my vocabulary.  Anyone who is moving in and out of stocks over the short term is a trader.  There's nothing wrong with that, it's just not for my retiree portfolio.

Whenever I talk about my retiree portfolio, I'm referring to my rolled-over 401k from my previous employer.  The analysts I've quoted are not necessarily looking to invest long term as I am.   

Parting Thoughts

In a former life, I would have never bet on me quoting Bill Clinton for any reason.  Now that I'm older, I appreciate that he was pragmatic.  I'm not sure I can say the same for central bankers.  In order to buy time for the economy to recover, central banks add liquidity, which keeps credits markets happy and that enables stock markets to rise.  If QE3 is announced, the S&P 500 may well rise up to a new all time high above 1565.

However, central banks are playing a dangerous game.  If the economy does not recover, can central banks keep adding liquidity without consequence?  What happens when the music stops?  What happens if the music stops in Europe or Japan or China?  Remember, all that debt is still not going away.

Ultimately even if this turns out to be a legitimate economic recovery, this is a risk that I do not want to take with my long term money.  After all, opportunities are easier to make up than losses.


Disclaimer: Please remember that I’m just a guy sharing information on a blog, and this is NOT official investment advice. Any action that you take as a result of information, analysis, or advertisement on this site is ultimately your responsibility. Please consult your investment adviser before making any investment decisions. During your conversation with said investment adviser, ask why they believe in their recommendation. If you are not convinced by their explanation, any action that you take or forego is also your responsibility. Just in case you missed that, you are responsible for your investments.

With that said, don’t let your investments keep you up at night. If they do keep you awake, you may be taking more risks than you are comfortable with. Talk to a professional about reallocating to less risky investments so that you can sleep. During your conversation with said professional, ask why they believe that their recommendation is less risky. If you are not convinced by their explanation, don’t invest. Remember:
  1. It’s your nest egg.
  2. Opportunities are easier to make up than losses.

Friday, February 17, 2012

To the Moon and Back

Fly me to the moon
Let me play among the stars
Let me see what spring is like
On a, Jupiter and Mars
In other words, hold my hand
In other words, baby, kiss me
- Frank Sinatra (Fly Me to the Moon)


When I first started thinking about this article, I focused on how the EU's Long Term Refinance Operation (LTRO) was approximately the same amount deposited overnight at the ECB (~€500 billion).  Since the banks were not using these funds, I questioned what was their reason for saving them.  Looking at the end of February, the LTRO may refinance up to €1.5 trillion in bank collateral. Now why would banks want to refinance that much if they haven't even made use of the December operation?

At first I thought maybe this was a new attempt to quietly create a firewall to contain a Greek default.  After all, €2.0 trillion was discussed over the summer as a reasonable amount to protect Spanish and Italian debt markets from any contagion. However upon further reading, I found a different reason.

$7.6 trillion

Now if I stopped the article hear, you might not think much more about it. So let me repeat, seven point six trillion dollars.  Again, no effect?  The debt crisis that the world is plodding through can make us immune to such large numbers when you consider the bailouts, lending programs, swaps, the size of the economy.  So let's put some perspective around this number, from OpEdNews: How can you visualize a trillion dollars? (emphasis mine)
Just how large is this, really?

Ok. I'm not the brightest bulb in the pack when it comes to math, but I wanted to imagine what a trillion dollars looks like. My former colleague at Cornell, Carl Sagan, used to speak of the number of Stars in the Universe as being "billions and billions". A trillion is a thousand billion, or a million million. In simple written numbers: A million is 1,000,000. A billion is 1,000,000,000. A trillion is 1,000,000,000,000. Easy enough.

So how tall is a stack of a trillion $1 bills? I'm sure someone will check my math done on a pocket calculator, but here goes.

A Ream (500 sheets) of ordinary copy paper like you use in your computer printer is about 2 inches tall. Paper that our Greenbacks are printed on may be a little thiner, but this is close enough for government work.

Therefore, a foot (12") of paper is about 3,000 sheets. 3,000 sheets x 5,280 feet per mile = 15,840,000 sheets per mile. Are we getting close? Not really. That's only about 16 million bucks, chunk change to our Congressional Critters.

OK. If we divide 1,000,000,000,000 sheets by 15,840,000 sheets per mile, we should get approximately how many MILES high a stack of a trillion Dollar Bills would be.

Canceling out zeros and rounding off so I can fit numbers into my limited calculator window, I come up with a little over 63,000 miles.
... our Earth is 24,907 miles around at it's Equator.
 So $1 trillion would wrap around the equator roughly 2.5 times.

Now while you may be calculating how many miles is $7.6 trillion, let's move on to what this money represents.  From Bloomberg, World’s Biggest Economies Face $7.6 Trillion Bond Tab as Rally Seen Fading.
Governments of the world’s leading economies have more than $7.6 trillion of debt maturing this year, with most facing a rise in borrowing costs.
...
The amount needing to be refinanced rises to more than $8 trillion when interest payments are included.
...
Italy auctioned 7 billion euros ($9.14 billion) of debt on Dec. 29, less than the 8.5 billion euros targeted. With an economy sinking into its fourth recession since 2001, Prime Minister Mario Monti’s government must refinance about $428 billion of securities coming due this year, the third-most, with another $70 billion in interest payments, data compiled by Bloomberg show.
Borrowing costs for G-7 nations will rise as much as 39 percent from 2011, based on forecasts of 10-year government bond yields by economists and strategists surveyed by Bloomberg in separate surveys. China’s 10-year yields may remain little changed, while India’s are projected to fall to 8.02 percent from 8.36 percent. The survey doesn’t include estimates for Russia and Brazil.
After Italy, France has the most amount of debt coming due, at $367 billion, followed by Germany at $285 billion. Canada has $221 billion, while Brazil has $169 billion, the U.K. has $165 billion, China (PRCH) has $121 billion and India $57 billion. Russia has the least maturing, or $13 billion. 
By the way, a one way trip to the moon is ~239,000 miles.  Bloomberg summarized this information nicely in a table at the end of the article:

 Table 1: Bond and Bill Redemptions and Interest Payments
Country 2012 Bond, Bill Redemptions ($) Coupon Payments (e.g. interest)
Japan
3,000 billion
117 billion
U.S.
2,783 billion
212 billion
Italy
428 billion  
72 billion
France
367 billion
54 billion
Germany
285 billion
45 billion
Canada
221 billion
14 billion
Brazil
169 billion
31 billion
U.K.
165 billion
67 billion
China
121 billion
41 billion
India
57 billion
39 billion
Russia
13 billion
9 billion

Have you figured it out yet?  Somewhere sovereign countries and their banks have to find the money that literally goes to the moon and back.  

Actually, they need more than this as Spain was not accounted for.  I found the following graph on Zero Hedge.  Note that Spain needs somewhere less than €200 billion in 2012.

Source: Zero Hedge

Scrutinizing this graph, I couldn't help to notice that while future funding needs drop off for 2013 and 2014, the amounts are not insubstantial.  Ultimately this leaves me pondering the following - where is all this cash going to come from?

IMF to the Rescue

So will the IMF come to the rescue?  Not likely as Peter Boockvar reports: IMF wants more cash, glass half full or half empty?
Glass half full reads the story that the IMF wants to increase its resources to $1T from the current $385b in an attempt to help ease the European debt crisis and glass half empty reads the IMF belief that there is a $2T funding gap over the next two years as extremely worrisome. On top of the $385b the IMF has, the EU has pledged an additional $185b (UK is holding out right now) and the IMF hopes that China, Brazil, Russia, India, Japan and those rich oil guys in the Mideast will stump up more cash to help.
So the IMF needs cash so that it can respond to crisis situations - namely rescuing Europe.  Again, where is all this cash going to come from?  Did you know that humans cannot touch their elbow with their tongue?

Have You Ever Heard of Sarko-nomics

Interestingly, I believe the answer is at hand, at least temporarily.  With the exception of Greece, Ireland, and Portugal, EU countries have been refinancing their debt in the market until late summer/fall 2011.  At this time, financial markets began to question whether Italy and Spain could repay their debts.  Interest rates in these two countries began to rise requiring the European Central Bank (ECB) to intervene by purchasing Italian and Spanish sovereign debt.  This aided keeping interest rates lower.  Keeping rates below 7% is critical as this was when Greece, Ireland, and Portugal needed bailouts.

However such intervention was undesirable as it was not within the ECB's mandate.  The ECB is prohibited from providing monetary assistance (e.g. quantitative easing). Furthermore, intervention was not a long term solution.

What about the European Financial Stability Facility (EFSF) and the European Stability Mechanism (ESM)?  The ESM is slated to be available in July 2012 with the ability to lend €500 billion.  As reported by Reuters, Euro zone faces lower EFSF lending power or higher guarantees.
The EFSF has an effective lending capacity of 440 billion euros thanks to guarantees from euro zone governments.
Because only six of the 17 countries sharing the euro had the highest AAA rating when the EFSF was set up, rating agencies demanded that the guarantees be much higher than the EFSF's actual lending power and equal 780 billion euros.
The loss of S&P's top rating by France and Austria means that without any changes, the EFSF's lending capacity will fall by 180 billion euros - the share of guarantees by Vienna and Paris for the fund, the senior official said.
Since the EFSF has now committed 43.7 billion euros to a financing programme for Ireland and Portugal, the loss of 180 billion would leave it 216.3 billion to finance a second programme for Greece and any other future euro zone needs.
Are you still trying to touch your elbow with your tongue? Even with the most recent talk about combining the EFSF and ESM, €700+ billion is not enough.

What about the Long Term Refinancing Operation (LTRO) by the ECB - didn't it loan out nearly €500 billion in December?  As revealed by Hussman Funds in Five Global Risks to Monitor in 2012, the €500 billion is more like €191 billion. (emphasis mine)
While there was much fanfare last month after the ECB loaned 523 banks 489 billion euros, the actual amount of new funds was a more modest number. This is because two earlier loan programs expired on the same day as the three-year LTRO was held, and banks probably rolled these funds into the three-year operation. The earlier operations included a 3-month loan of 141 billion euros offered in September, and a net 112 billion euros of overnight loans. The ECB also allowed banks to shift 45 billion euros from an October operation into the 3-year LTRO. Of the 489 billion Euros operation, that left about 191 billion euros of fresh loans.
Channeling Chief Brody from Jaws, we're going to need a bigger boat.  Enter Sarko-nomics as revealed by PrudentBear.com: Europe’s Chronic Disease.
Europe will be forced to resort to “Sarko-nomics” to finance itself - European banks purchase sovereign debt, which is then pledged as collateral to borrow unlimited funds from the ECB or national central banks.

This perpetuates the circular flow of funds with governments supporting banks that are in turn supposed to bail out the government. It does not address the unsustainable high cost of funds for countries like Italy. If its cost of debt stays around current market rates, then Italy’s interest costs will rise by about euro 30 billion over the next two years, from 4.2% of GDP currently to 5.1% next year and 5.6% in 2013.

Debt reduction through restructuring remains off the agenda. The adverse market reaction to the announcement of the 50% Greek writedown forced the EU to assure investors that it was a one-off and did not constitute a precedent. Despite this, investors remain sceptical, limiting purchases of European sovereign debt.
So in order to get the cash, banks are going to have to lend their loans to the ECB to get more cash through the LTRO.  The banks can then refinance the debt coming due with this new cash, which they also owe to the ECB in order to get their original loans back.  Is your head spinning?  That's the perpetually circular flow of funds that author Satyajit Das was talking about.

So We've Got the Bigger Boat

Answering where the cash is going to come from, it's going to be printed into existence - poof!  Through the LTRO, the ECB has found a means to temporarily bend the rules and print money.


However, we didn't get a bigger boat.  While there is relief in the credit markets, it is only temporary as the LTRO only is a 3 year lending program.  Although debt could be rolled over after 3 years, the debt still remains - in fact it rises.  Banks earn a profit on the spread of borrowing at 1% and lending at higher rates, but the ECB is taking lower credit quality assets that pose more risk onto its balance sheet.

In other words, nothing is saved - only more time was bought to try and find a solution.

So How Does This Affect Me in the US

Since about the end of January, I keep reading more and more analysts, fund managers, and financial professionals buying stocks.  Up until this time, I've had trouble figuring out why because of the risks I've highlight in articles such as Good News From Europe, Though I Have Trouble Seeing ItIt's Just a Minor Flesh Wound, and Stay True to the Path or Take the Fork in the Road.

Yet today I read U.S. stocks and gold to drive higher in Marketwatch from Mary Anne & Pamela Aden. Over the years, I have sporadically read their work and been impressed as they never follow the crowd. Today however that changed, so I sat up when I read:
U.S. stocks and gold are leading the way. In fact, these are our top picks for the months ahead and they're looking good. Here's why ...

— Gold has been a consistent winner year after year. The technicals are bullish and so are the fundamentals. Gold's bull market rise will remain intact by staying above $1560.

Due to monetary uncertainties and massive debt, central banks are big gold buyers. And so is the public, especially in China, India and other emerging nations. This is keeping demand strong.

Ongoing government spending, monetization, low interest rates in the Western world and weak currencies are also putting upward pressure on gold and silver.

These are the basic reasons why gold will continue to head higher, and it's why we like SPDR Gold Shares and iShares Silver Trust.

— Stocks have been moving up on improving economic news, as well as the fact the Fed stands ready to jump in again, if needed, to help boost the economy.

Europe has also calmed down somewhat and taken together, these two factors have led to a sense of calm and some optimism. That is, investors have chosen to focus on the good news for now, even though the fundamental reality has not changed.

As you know, sentiment drives the markets, not necessarily reality. As investors, our reality has to be accepting the current sentiment.
The Adens have recommended gold for many years now, but I cannot recall ever reading a recommendation on buying stocks.  Granted, they hedge their enthusiasm by saying that these are their top picks for the months ahead. Still they have good company as noted in How Many Bulls in this Rodeo, Clowns Want to Know and James Bond Isn't the Only Dangerous Bond.  

Parting Thoughts  

I'm still not sold on buying stocks for my "retiree" nest egg, but I do find that I'm questioning it more every day.  I am still bullish on gold, gold ETFs, and gold miners as there doesn't seem to be an end in sight of central bank programs to aid the global economy.  Please note that I am invested in these types of assets.

Remember, repay, restructure, or default are the only solutions to ridding oneself of debt.  Can the ECB continue to delay the tough choices that the EU keeps deciding to forego?  I don't know.  I can only wait and watch.


Disclaimer: Please remember that I’m just a guy sharing information on a blog, and this is NOT official investment advice. Any action that you take as a result of information, analysis, or advertisement on this site is ultimately your responsibility. Please consult your investment adviser before making any investment decisions. During your conversation with said investment adviser, ask why they believe in their recommendation. If you are not convinced by their explanation, any action that you take or forego is also your responsibility. Just in case you missed that, you are responsible for your investments.

With that said, don’t let your investments keep you up at night. If they do keep you awake, you may be taking more risks than you are comfortable with. Talk to a professional about reallocating to less risky investments so that you can sleep. During your conversation with said professional, ask why they believe that their recommendation is less risky. If you are not convinced by their explanation, don’t invest. Remember:
  1. It’s your nest egg.
  2. Opportunities are easier to make up than losses.